import pandas as pd
import tensorflow as tf
from keras.layers import Input, Dense
from keras.models import Model
from sklearn.metrics import precision_recall_fscore_support
import matplotlib.pyplot as plt
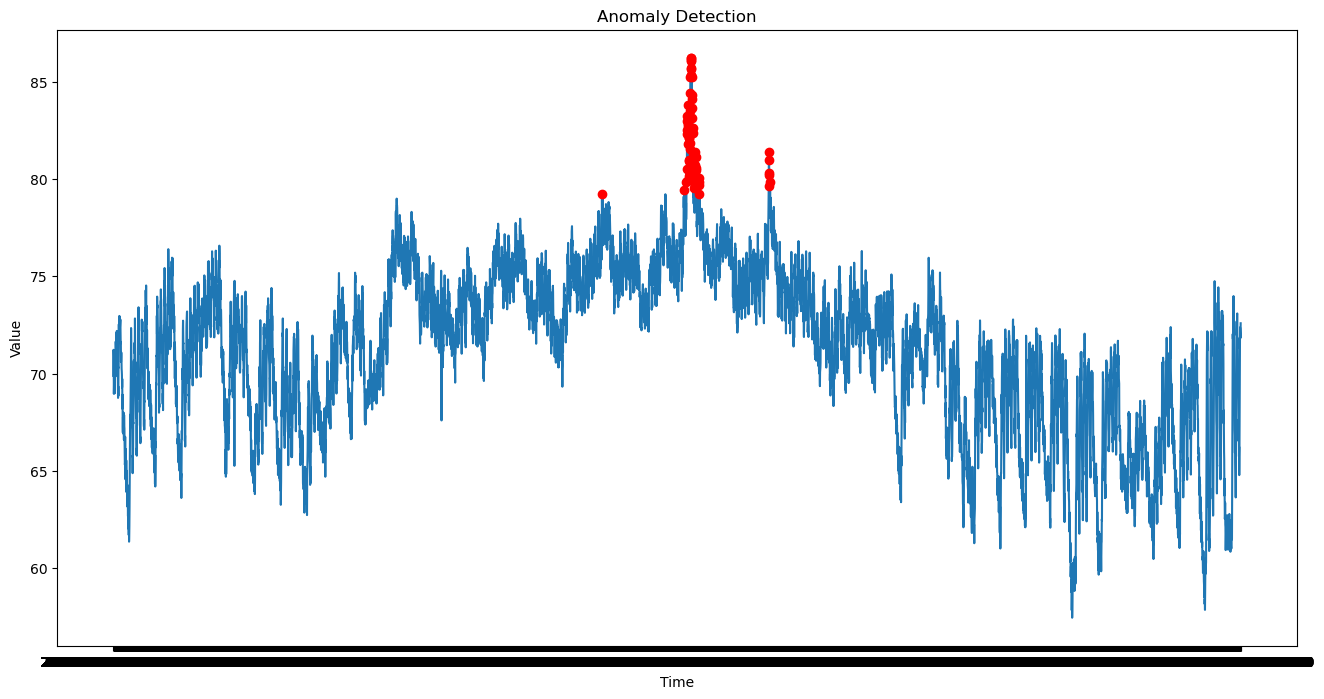
Anomaly Detection in Time Series Data
Anomaly detection in time series data may be helpful in various industries, including manufacturing, healthcare, and finance. Anomaly detection in time series data may be accomplished using unsupervised learning approaches like clustering, PCA (Principal Component Analysis), and autoencoders.
What is an Anomaly Detection Algorithm?
Anomaly detection is the process of identifying data points that deviate from the expected patterns in a dataset. Many applications, including fraud detection, intrusion detection, and failure detection, often use anomaly detection techniques. Finding uncommon or very infrequent events that could point to a possible hazard, issue, or opportunity is the aim of anomaly detection.
The autoencoder algorithm is an unsupervised deep learning algorithm that can be used for anomaly detection in time series data. The autoencoder is a neural network that learns to reconstruct its input data By first compressing input data into a lower-dimensional representation and then extending it back to its original dimensions. An autoencoder may be trained on typical time series data to learn a compressed version of the data for anomaly identification. The anomaly score may then be calculated using the reconstruction error between the original and reconstructed data. Anomalies are data points with considerable reconstruction errors.
Time Series Data and Anamoly Detection
In the case of time series data, anomaly detection algorithms are especially important since they help us spot odd patterns in the data that would not be obvious from just looking at the raw data. Anomalies in time series data might appear as abrupt increases or decrease in values, odd patterns, or unexpected seasonality. Time series data is a collection of observations across time.
Time series data may be used to teach anomaly detection algorithms, such as the autoencoder, how to represent typical patterns. These algorithms can then utilize this representation to find anomalies. The approach can learn a compressed version of the data by training an autoencoder on regular time series data. The anomaly score may then be calculated using the reconstruction error between the original and reconstructed data. Anomalies are data points with considerable reconstruction errors. Anomaly detection algorithms may be applied to time series data to find odd patterns that could point to a hazard, issue, or opportunity. For instance, in the context of predictive maintenance, a time series anomaly may point to a prospective equipment failure that may be fixed before it results in a large amount of downtime or safety concerns. Anomalies in time series data may reveal market movements or patterns in financial forecasts that may be capitalized on. The reason for getting precision, recall, and F1 score of 1.0 is that the “ambienttemperaturesystem_failure.csv” dataset from the NAB repository contains anomalies. If we had gotten precision, recall, and F1 score of 0.0, then that means the “ambient_temperature_system_failure.csv” dataset from the NAB repository does not contain anomalies.
注意:
1.所有代码均经过运行测试,没有问题。
2.拍前请仔细阅读作品简介,这非常重要,因为涉及到不同的编程语言(Python或matlab)。
3.程序为特殊商品,经售出不退,有问题请及时联系。
4.建议有一定Python或Matlab基础的同学或工程师购买。
5.该代码不讲解哦。