1.数据说明:
数据来源
是针对变压器上的负荷变化进行研究,每15分钟采集一次负荷数据,也就是说一天内的负荷曲线由4*24=96个点组成,这份数据集里不仅考虑了历史负荷数据对负荷变化的影响,还考虑了当天的温度情况。

![]() 编辑2.训练集与测试集的划分
编辑2.训练集与测试集的划分
取2013年9月1日到2014年8月31日作为训练集,取2014年9月1日到9月30日作为测试集
输入特征:预测日的前两周数据
输出特征:预测日内96个点的大小
3.DNN代码
# -*- coding: utf-8 -*-
"""
Created on Wed Apr 13 11:02:02 2022
@author: pony
"""
import matplotlib.pyplot as plt
import pandas as pd
import numpy as np
import pickle
import keras
import warnings
warnings.filterwarnings("ignore")
data = pd.read_csv("p.csv")
parts = 14
this_one = data.iloc[parts:]#取14行以后数据
bak_index = this_one.index#取索引
for k in range(1, parts + 1):
last_one = data.iloc[(parts - k):(this_one.shape[0] - k + parts)]
this_one.set_index(last_one.index, drop=True, inplace=True)
this_one = this_one.join(last_one, lsuffix="", rsuffix="_p" + str(k))
this_one.set_index(bak_index, drop=True, inplace=True)
this_one = this_one.fillna(0)#用0填充缺失值
t0 = this_one.iloc[:, 0:96]#取0-96列
t0_min = t0.apply(lambda x: np.min(x), axis=0).values#每一列的最小值
t0_ptp = t0.apply(lambda x: np.ptp(x), axis=0).values#最大值和最小值的差值
this_one = this_one.apply(lambda x: (x - np.min(x)) / np.ptp(x), axis=0)#归一化
'''
划分训练集与测试集
'''
test_data = this_one.iloc[-30:]#最后30天当做测试集
train_data = this_one.iloc[:-30]
train_y_df = train_data.iloc[:, 0:96]#取前96列当做标签
train_y = np.array(train_y_df)
train_x_df = train_data.iloc[:, 96:]#取96列以后,也就是前14天的数据作为特征输入
train_x = np.array(train_x_df)
test_y_df = test_data.iloc[:, 0:96]
test_y = np.array(test_y_df)
test_x_df = test_data.iloc[:, 96:]
test_x = np.array(test_x_df)
test_y_real = t0.iloc[-30:]#测试集归一化前的真实标签
'''
建立模型
'''
import keras
import pickle
init = keras.initializers.glorot_uniform(seed=1)
simple_adam = keras.optimizers.Adam()
model = keras.models.Sequential()
model.add(keras.layers.Dense(units=512, input_dim=1434, kernel_initializer=init, activation='relu'))
model.add(keras.layers.Dense(units=256, kernel_initializer=init, activation='relu'))
model.add(keras.layers.Dense(units=128, kernel_initializer=init, activation='relu'))
model.add(keras.layers.Dropout(0.1))
model.add(keras.layers.Dense(units=96, kernel_initializer=init, activation='tanh'))
model.compile(loss='mse', optimizer=simple_adam, metrics=['accuracy'])
model.fit(train_x, train_y, epochs=100, batch_size=32, shuffle=True, verbose=True)
pred_y = model.predict(test_x)
pred_y = (pred_y*t0_ptp)+t0_min
import pickle
import matplotlib.pyplot as plt
import matplotlib
# 以下 font.family 设置仅适用于 Mac系统,其它系统请使用对应字体名称
matplotlib.rcParams['font.family'] = 'Arial Unicode MS'
import numpy as np
realdf = test_y*t0_ptp[0:96]+t0_min[0:96]
base = 0
error = 0
plt.figure(figsize=(20, 10))
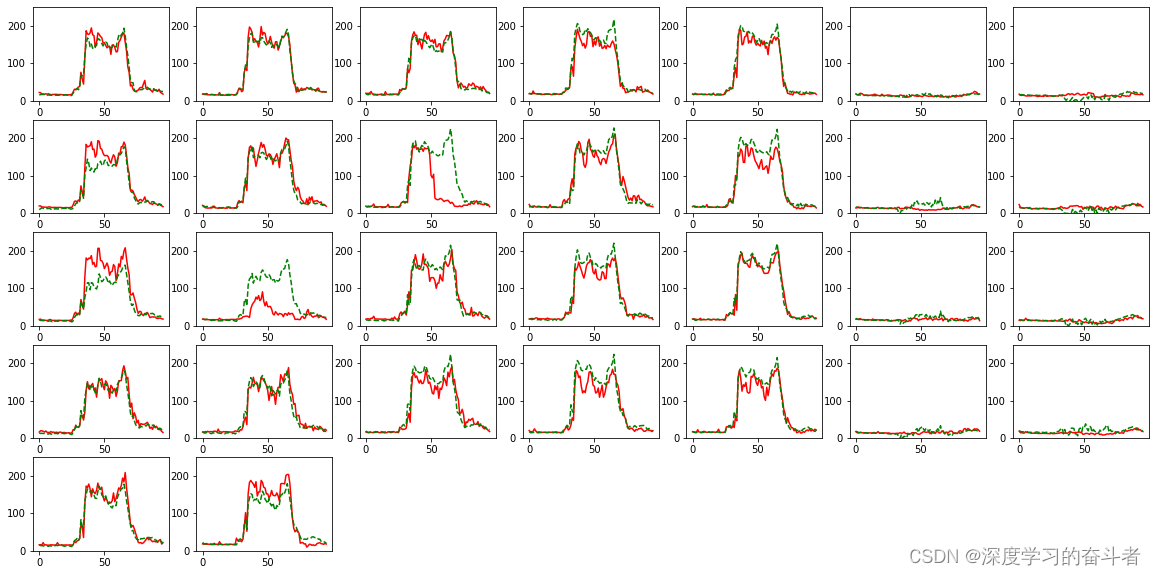
for index in range(0, 30):
real_array = realdf[index][0:96]
pred_array = pred_y[index][0:96]
pred_array[np.where(pred_array < 0)] = 0
plt.subplot(5, 7, index + 1)
plt.plot(range(96), real_array, '-', label="real",c='red')
plt.plot(range(96), pred_array, '--', label="pred",c='green')
plt.ylim(0, 250)
base = base + np.sum(real_array)
error = error + np.sum(np.abs(real_array-pred_array))
plt.show()
v = 100*(1-error/base)
print("Evaluation on test data: accuracy = %0.2f%% \n" % v)
# Evaluation on test data: accuracy = 74.95%
![]()
DNN测试集结果图(每个小图是一天,一共是30天):

![]() 编辑
编辑
4. CNN_BiLSTM_Attention模型,LSTM模型的结果分别是
![]() 编辑
编辑
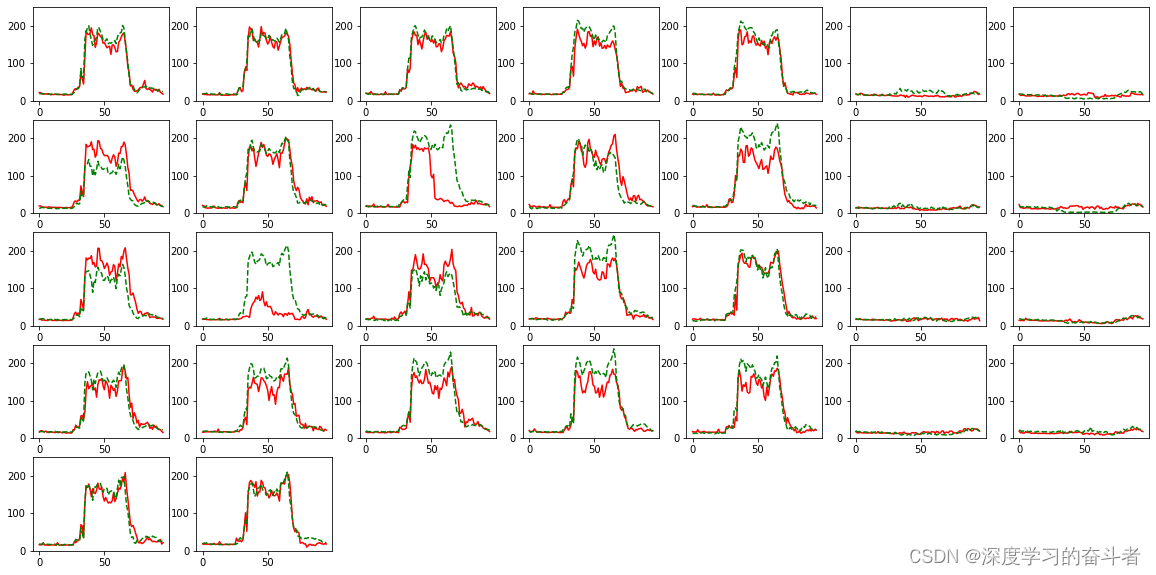
![]() 编辑
编辑
5.通过计算累积误差率,CNN_BiLSTM_Attention模型,LSTM模型,DNN模型的整体精度分别为:80.89%,78.68%,75.44%。