目录

![]() 编辑
编辑
摘要
使用BP神经网络实现简单的电力负荷回归预测任务。主要的步骤为:导入数据、数据归一化、建立BP神经网络、训练BP神经网络、使用测试数据预测负荷情况、误差分析以及绘图。
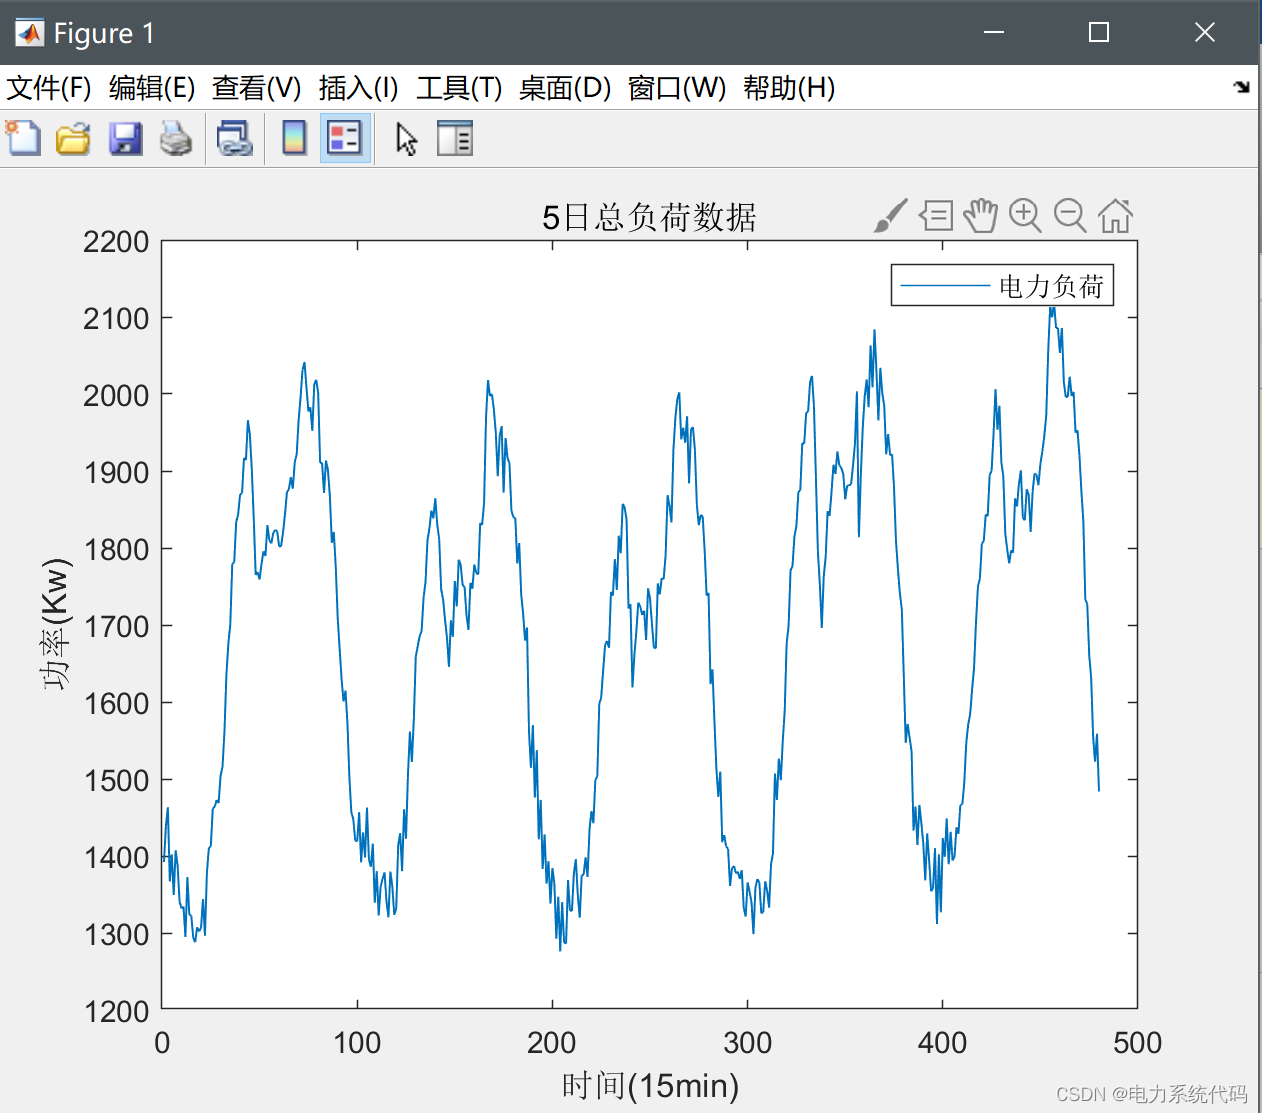
一、电力负荷数据导入
使用Matlab中的xlsread函数从指定的excel文件中提取电力负荷数据,可以自己制定需要导入的天数,这里设置导入5天的数据,如下图所示:
![]() 编辑
编辑
其他全部数据:

![]() 编辑
编辑
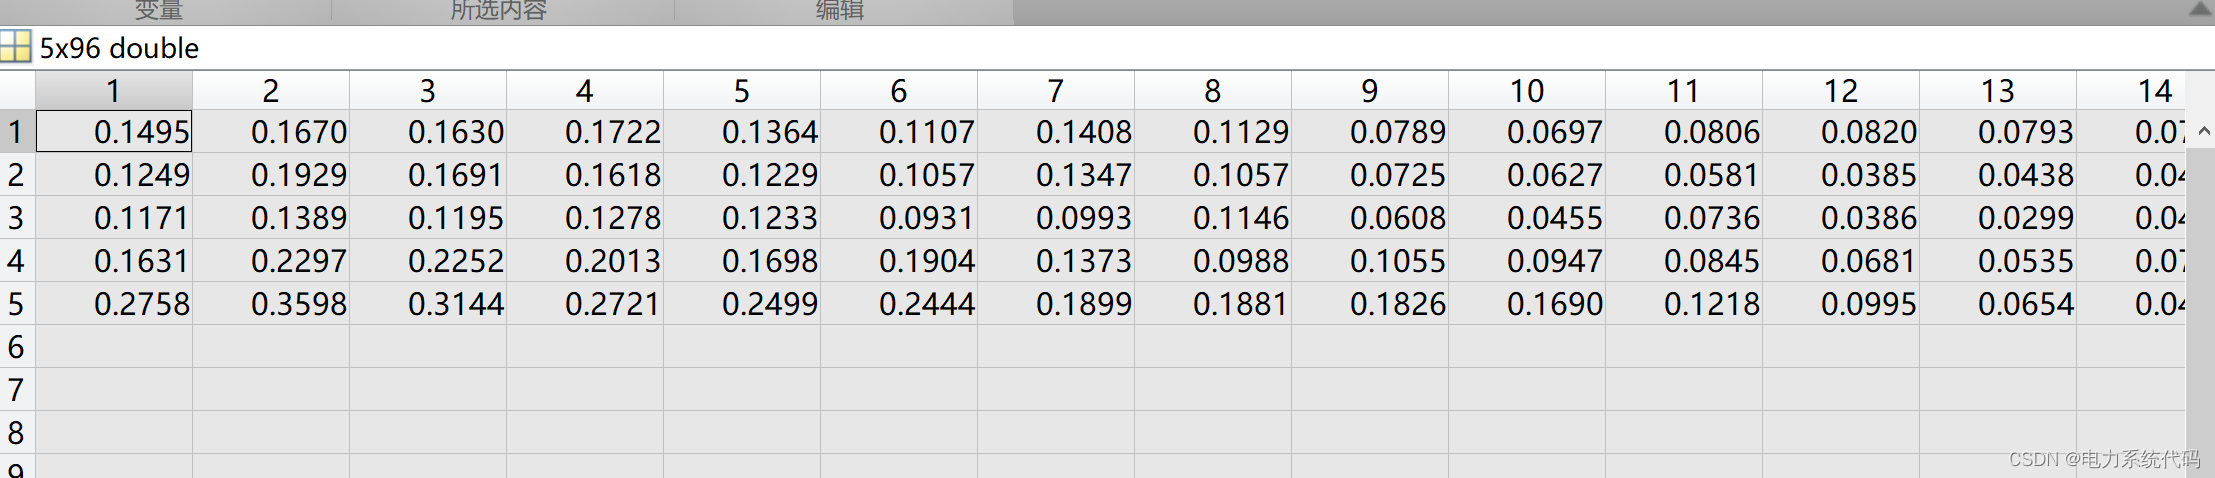
二、输入输出数据归一化
虽然神经⽹络的各层的输⼊信号分布不同,但最终“指向“的样本标记是不变的,即边缘概率不同⽽条件概率⼀致。 为了降低分布变化的影响,可使⽤归⼀化策略Normalization,把数据分布映射到⼀个确定的区间。神经⽹络中,常⽤的归⼀化策略有BN(Batch Normalization), WN(Weight Normalization), LN(Layer Normalization),IN(Instance Normalization)。
这里使用max-min归一化方法将数据全部归一化到0-1之间,归一化后的数据如下:
![]() 编辑
编辑
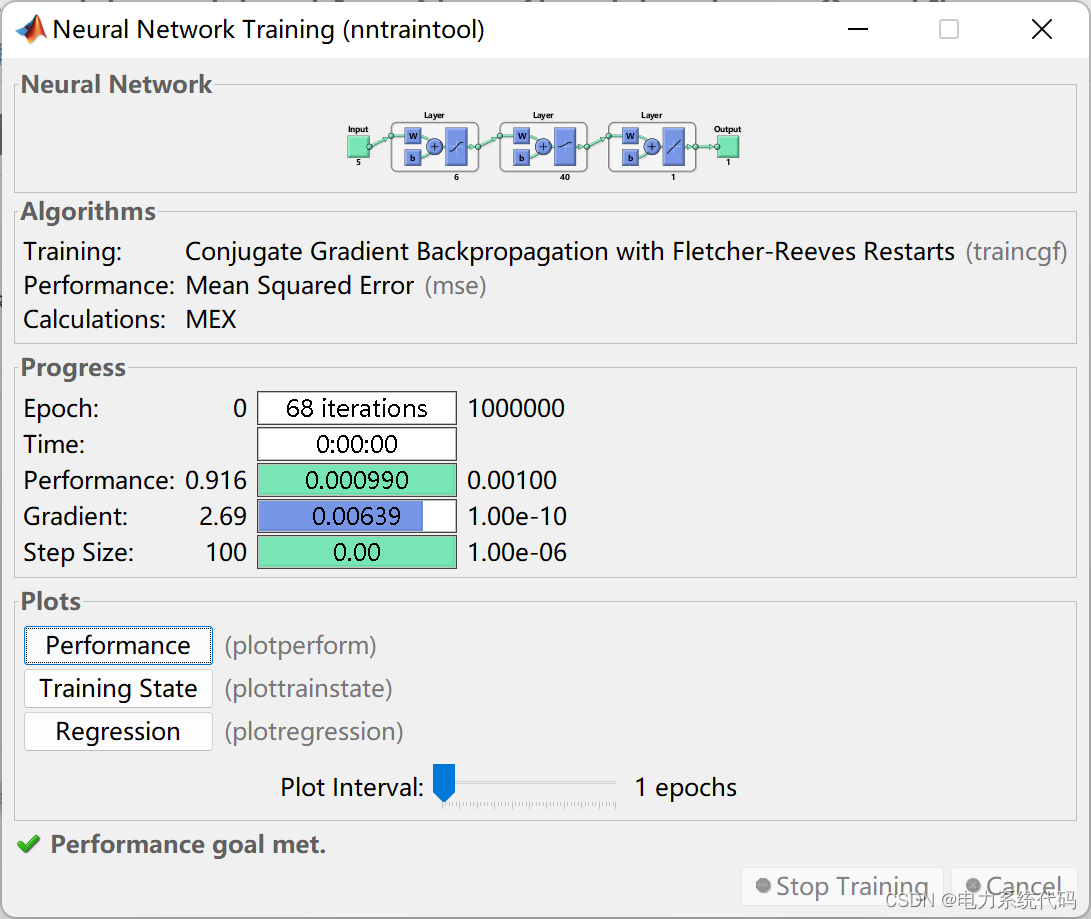
三、建立和训练BP神经网络
指定输入特征个数为1,输出特征个数为1,设置神经元个数为100,设置学习率为0.001,使用Matlab中的newff函数建构BP神经网络,使用train函数训练BP神经网络:
![]() 编辑
编辑
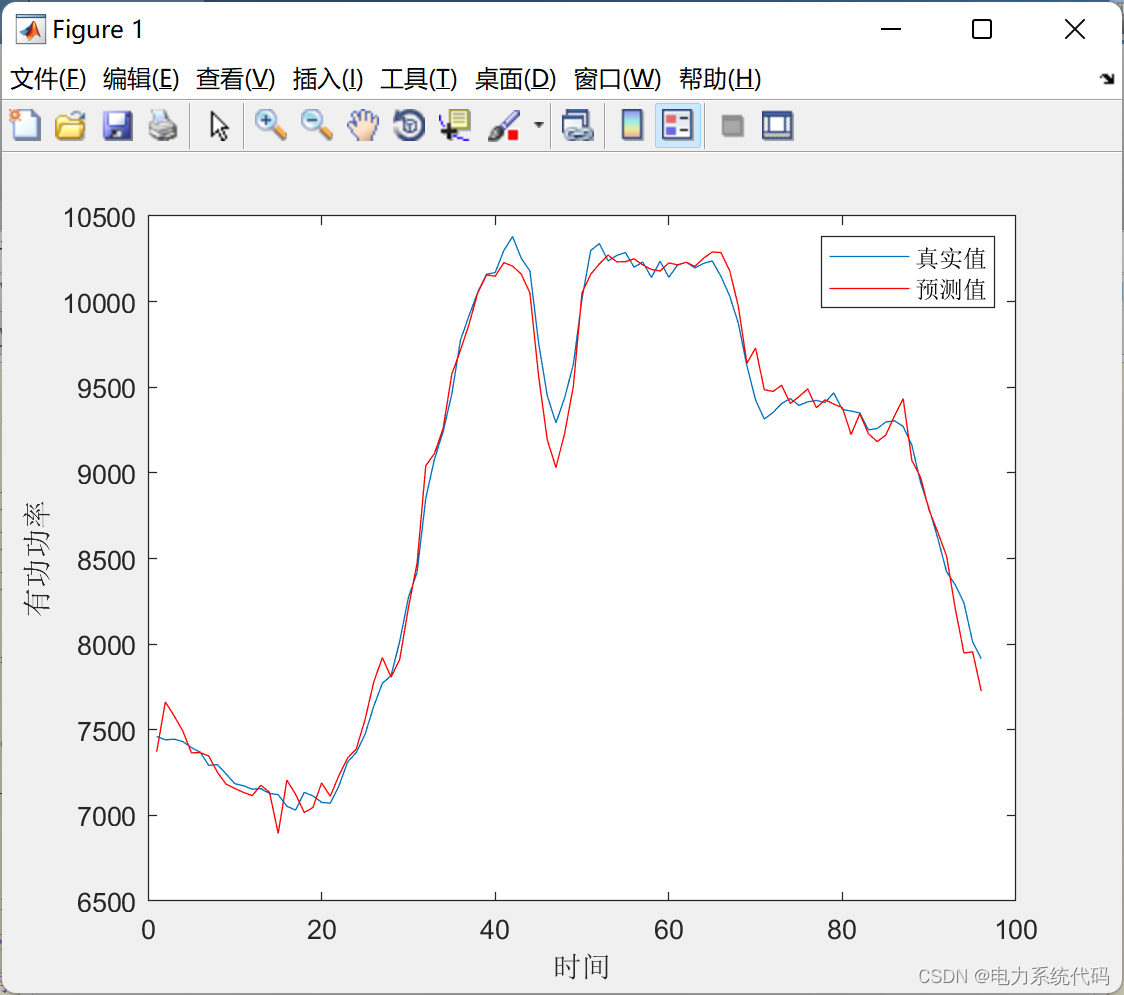
四、 使用测试数据进行负荷预测
测试结果:
![]() 编辑
编辑
五、Matlab代码展示
本文仅展示部分代码,完整代码点这里:
clc;
clear;
close all;
%% 导入数据
month = 12;  %训练月份
day_start = 5; %开始日期
day_len = 5;  %训练天数

file_path = '2018负荷预测数据';
map_maxmin = [];
output = [];
%% 数据分组及归一化
for day = day_start:1:(day_start + day_len - 1)
    [raw_data, raw_max ,raw_min] = read_load_data_from_excel(file_path, month ,day); % 从文件夹读取数据
    % 输入与输出归一化
    data_temp =  my_map(1, raw_data, raw_max, raw_min, 1, 0);
    map_maxmin = cat(1, map_maxmin, [0 1]);
    output = cat(1, output, data_temp);
    target_day = day + 1;
end
[target_data, target_max, target_min] = read_load_data_from_excel(file_path, month ,target_day);
t_d =  my_map(1, target_data, target_max, target_min, 1, 0);
%% 创建网络
![]()