%% %% The software copyright is ultimately owned by Lwcah.(公众号:Lwcah)
clear all;close all;clc
%% 一幅图的时候figureWidth = 16;figureHeight = 11;调整这两个参数就可以
%定义整幅图出现的在电脑屏幕上的位置以及长和宽
figureHandle = figure;
figureUnits = 'centimeters';
figureWidth = 16;%17
figureHeight = 9;%24
set(gcf, 'Units', figureUnits, 'Position', [0 0 figureWidth figureHeight]);
%% 字号
fontnamed='STFangSong';%字号名字
ssize=10;%字号大小
%% 给定绘图颜色
C1 = chinesecolors(4);%香叶红
C2 = chinesecolors(8);%茶花红
C3 = chinesecolors(12);%合欢红
C4 = chinesecolors(17);%鹅冠红
C5 = chinesecolors(37);%山黎豆红
C6 = chinesecolors(62);%夹竹桃红
C7 = chinesecolors(77);%葡萄酒红
C8 = chinesecolors(463);%芙蓉红
C9 = chinesecolors(470);%蟹蝥红
C10 = chinesecolors(495);%极光红
C11 = chinesecolors(505);%樱桃红
%%
x=0:0.1:5;
y1=2*sin(2*x)+10;y2=2*sin(2*x)+9;y3=2*sin(2*x)+8;y4=2*sin(2*x)+7;y5=2*sin(2*x)+6;
y6=2*sin(2*x)+5;y7=2*sin(2*x)+4;y8=2*sin(2*x)+3;y9=2*sin(2*x)+2;y10=2*sin(2*x)+1;
h1=plot(x,y1,'o','linewidth',1,'color',C1,'MarkerSize',3,'MarkerFace',C1);hold on;%圆的大小,颜色和填充充满
h2=plot(x,y2,'o','linewidth',1,'color',C2,'MarkerSize',3,'MarkerFace',C2);hold on;
h3=plot(x,y3,'o','linewidth',1,'color',C3,'MarkerSize',3,'MarkerFace',C3);hold on;
h4=plot(x,y4,'o','linewidth',1,'color',C4,'MarkerSize',3,'MarkerFace',C4);hold on;
h5=plot(x,y5,'o','linewidth',1,'color',C5,'MarkerSize',3,'MarkerFace',C5);hold on;
h6=plot(x,y6,'o','linewidth',1,'color',C6,'MarkerSize',3,'MarkerFace',C6);hold on;
h7=plot(x,y7,'o','linewidth',1,'color',C7,'MarkerSize',3,'MarkerFace',C7);hold on;
h8=plot(x,y8,'o','linewidth',1,'color',C8,'MarkerSize',3,'MarkerFace',C8);hold on;
h9=plot(x,y9,'o','linewidth',1,'color',C9,'MarkerSize',3,'MarkerFace',C9);hold on;
h10=plot(x,y10,'o','linewidth',1,'color',C10,'MarkerSize',3,'MarkerFace',C10);hold on;
%% 画图的标准格式代码
text(2.5,14,'中国红','fontsize',ssize,'FontName',fontnamed,'horiz','center','color',C11);
xlabel('X','fontsize',ssize,'FontName',fontnamed);
ylabel('Y','fontsize',ssize,'FontName',fontnamed);
axis([-1 6 -5 15]);
xticks([-1 0 1 2 3 4 5]);%画格网的时候的小刻度
xticklabels({'-1','0','1','2 ','3','4','5','6'});%加x轴刻度标注
yticks([-5 0 5 10 15]);%画格网的时候的小刻度
yticklabels({'-5','0','5','10','15'});%加y轴刻度标注
set(gca,'linewidth',1,'fontsize',ssize,'FontName',fontnamed);
% set(gca,'xticklabel',[]);%x轴不显示刻度
% set(gca,'yticklabel',[]);%y轴不显示刻度
% set(gca,'XColor','white');%X轴不显示
% set(gca,'YColor','white');%Y轴不显示
hLegend1 = legend([h1,h2,h3,h4,h5],'香叶红','茶花红','合欢红','鹅冠红', '山黎豆红 ','Location', 'northeast','Box', 'off','Orientation','horizontal','fontsize',ssize,'FontName',fontnamed);
ah=axes('position',get(gca,'position'),'visible','off');
hLegend2 = legend(ah,[h6,h7,h8,h9,h10],'夹竹桃红 ','葡萄酒红','芙蓉红','蟹蝥红','极光红','Location', 'northeast','Box', 'off','Orientation','horizontal','fontsize',ssize,'FontName',fontnamed);
% 'north' | 'south' | 'east' | 'west' |
% 'northeast' | 'northwest' | 'southeast' | 'southwest' | 'northoutside' |
% 'southoutside' | 'eastoutside' | 'westoutside' | 'northeastoutside' |
% 'northwestoutside' | 'southeastoutside' | 'southwestoutside' | 'best' |
% 'bestoutside' | 'none'
hold on;grid on;box on;
%% 背景颜色
set(gcf,'Color',[1 1 1])
%% 图片输出
figW = figureWidth;
figH = figureHeight;
set(figureHandle,'PaperUnits',figureUnits);
set(figureHandle,'PaperPosition',[0 0 figW figH]);
fileout = '中国红';
print(figureHandle,[fileout,'.svg'],'-r800','-dsvg');

chinesecolors.p就是本文的子函数
chinesecolors就是本文的MATLAB绘图所需用到的子函数,上述代码绘图如下:
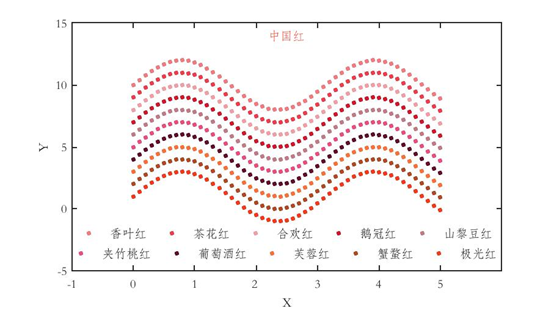
下面简单介绍下该绘图子函数的由来及其特点:
(1)作者科研过程中MATLAB制图需要;
(2)致力于寻找好看的颜色+诗意的名字;
(3)中国色色谱(http://zhongguose.com/#anyuzi) 1:1制作完成,下面直接上升级版子函数及其说明书。