


2021年下半年的数维杯开始了,这次比赛是为了几个月后的美赛做准备,相当于一次练手。
小编我看了一下B题“极端降雨的定量分析”。想了一下初步思路,整理如下,希望对大家有所帮助。
请转链接:
问题一:
v> Quantitative analysis of extreme rainfall
In the past two years, Henan, Shaanxi, Hubei and other places of our country
have encountered extremely rare heavy rainfall. At the same time, some northern
cities have encountered historically rare blizzards. These heavy rains and snowfalls
pose a serious threat to the local people about their lives, safety and properties. Take
Zhengzhou as an example. From 18:00 on July 18 to 0:00 on the 21st, the city of
Zhengzhou saw heavy rainstorms and extreme heavy rains. The cumulative average
precipitation was 449 mm. The rainfall at the Zhengzhou station reached 201.9 mm
from 16:00 to 17:00 on the 20th, which exceeding the extreme value of rainfall per
hour on the land of my country. And Zhengzhou, a city with a population of tens of
millions, is undergoing the test of heavy rain. The heavy rain began intermittently on
July 17, and by the morning of July 20, the rain suddenly began to increase. By the
afternoon of the same day, many communities and roads in Zhengzhou were flooded
by rain. The Zhengzhou Meteorological Bureau released information that the average
annual rainfall in Zhengzhou is 640.8mm, and the rainfall in these three days is close
to or even more than that of previous years. From the perspective of climatology, it is
once in a thousand years. The continuous heavy rainfall in Zhengzhou, Henan has
caused huge losses to the safety of people's lives and property in Zhengzhou, and has
severely affected production and life. As of 12:00 on July 23, according to
preliminary statistics, 395,989 people were urgently transferred and resettled, crops
affected area of 44,209.73 hectares, direct economic losses were 655 billion yuan, and
floods and secondary disasters caused by heavy rains have killed hundreds of people.
According to relevant researchers, in the context of global warming, the amount,
intensity, frequency and type of future precipitation in my country will be directly
affected. The amount of precipitation is expected to increase by about 10% at the end
of this century and the probability of extreme precipitation will increase significantly.
Due to the large land area of our country and the combined influence of various types
of topography and landforms and other factors, the precipitation characteristics of
different cities show different characteristics. Therefore, it is imperative to establish
prediction models for cities with different potential extreme precipitation events and
quantitative analysis models for their losses.
Attachment 1 shows the daily precipitation observation data of three
meteorological stations near Zhengzhou City for the past 70 years. Try to use
mathematical modeling to solve the following problems:
Question 1: Carry out the relevant analysis of the annual change characteristics of the
precipitation characteristics in Zhengzhou area and screen out a number of years with
higher precipitation. At the same time, make a specific quantitative analysis of the
inundation event of Zhengzhou in 2021.
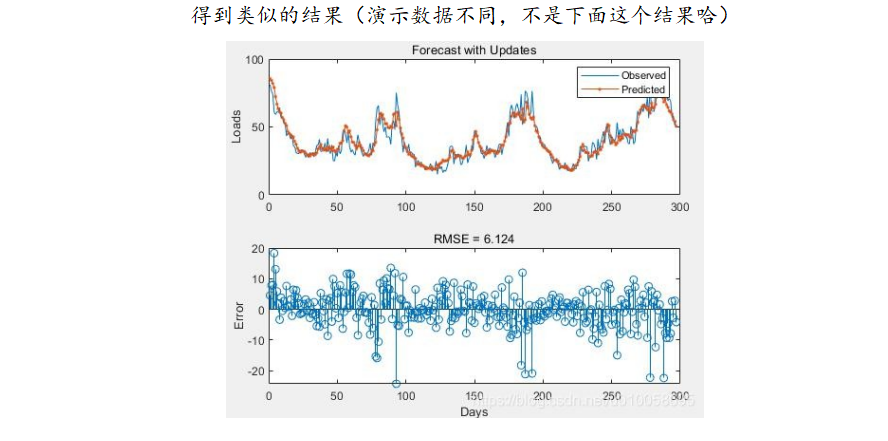
Question 2: Can you collect and sort out the precipitation data of more cities in our
country for many years, and analyze the trend of precipitation in these cities? (It is
necessary to clearly indicate the source of the data and how to obtain it)
Question 3: Can you use the collected urban weather data to predict and analyzepotential cities with extreme rainfall in the future based on different methods, and
compare and analyze your prediction effects?
Question 4: Do you think the characteristics of the heavy rainfall in Zhengzhou in
July 2021 are the same as those in Shanxi in October 2021? What is the difference in
the losses caused.
Question 5: Can you propose a long-term construction plan for cities in the future
under extreme precipitation conditions, in which in-depth analysis of typical cities in
my country is particularly necessary.
The description of data:
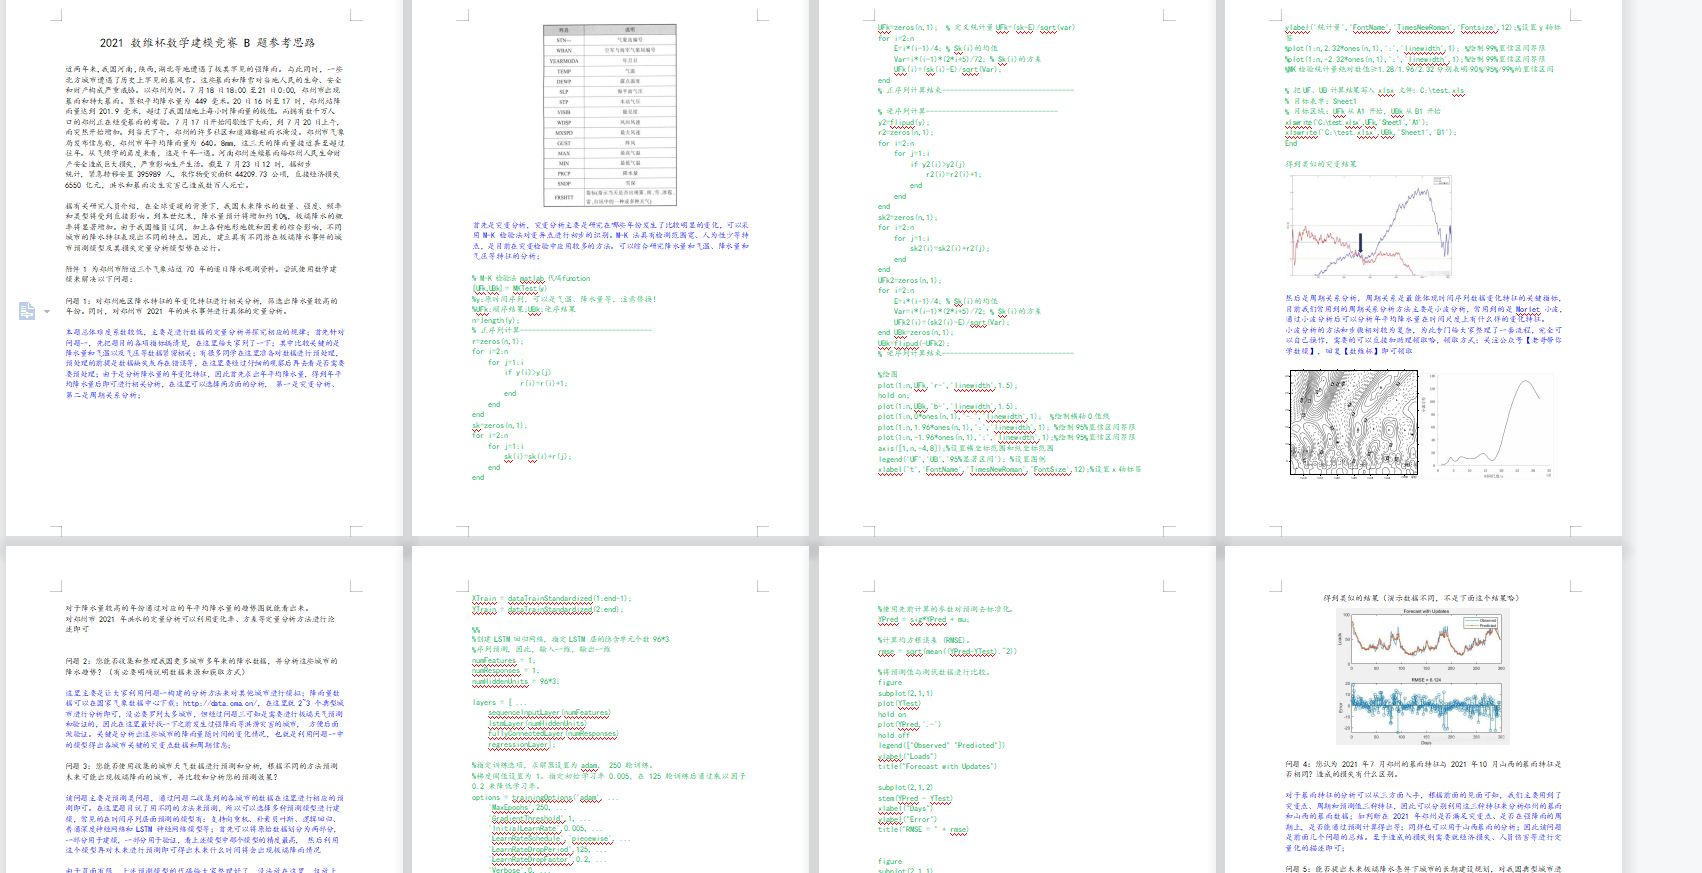
Attachment 1 is the 70-year meteorological observation data of various
meteorological stations in Annex 3 of Zhengzhou City.
Your submission should consist of:
One-page Summary Sheet
Table of Contents
One -to Two -page Article
Your solution of no more than 20 pages, for a maximum of 24 pages with your
summary, table of contents, and article
Note: Reference List and any appendices do not count toward the page limit and
should appear after your complete solution. You should not make use of unauthorized
images and materials whose use is restricted by copyright laws. Ensure you cite the
sources for your ideas and the materials used in your report.
近两年来,我国河南,陕西,湖北等地遭遇了极其罕见的强降雨。与此同时,一些北方城市遭遇了历史上罕见的暴风雪。这些暴雨和降雪对当地人民的生命、安全和财产构成严重威胁。以郑州为例。7 月 18 日 18:00 至 21 日 0:00,郑州市出现
暴雨和特大暴雨。累积平均降水量为 449 毫米。20 日 16 时至 17 时,郑州站降
雨量达到 201.9 毫米,超过了我国陆地上每小时降雨量的极值。而拥有数千万人
口的郑州正在经受暴雨的考验。7 月 17 日开始间歇性下大雨,到 7 月 20 日上午, 雨突然开始增加。到当天下午,郑州的许多社区和道路都被雨水淹没。郑州市气象局发布信息称,郑州市年平均降雨量为 640。8mm,这三天的降雨量接近甚至超过往年。从气候学的角度来看,这是千年一遇。河南郑州连续暴雨给郑州人民生命财产安全造成巨大损失,严重影响生产生活。截至 7 月 23 日 12 时,据初步
统计,紧急转移安置 395989 人,农作物受灾面积 44209.73 公顷,直接经济损失
6550 亿元,洪水和暴雨次生灾害已造成数百人死亡。
据有关研究人员介绍,在全球变暖的背景下,我国未来降水的数量、强度、频率和类型将受到直接影响。到本世纪末,降水量预计将增加约 10![]() ,极端降水的概率将显著增加。由于我国幅员辽阔,加上各种地形地貌和因素的综合影响,不同城市的降水特征表现出不同的特点。因此,建立具有不同潜在极端降水事件的城市预测模型及其损失定量分析模型势在必行。
,极端降水的概率将显著增加。由于我国幅员辽阔,加上各种地形地貌和因素的综合影响,不同城市的降水特征表现出不同的特点。因此,建立具有不同潜在极端降水事件的城市预测模型及其损失定量分析模型势在必行。
附件 1 为郑州市附近三个气象站近 70 年的逐日降水观测资料。尝试使用数学建模来解决以下问题:
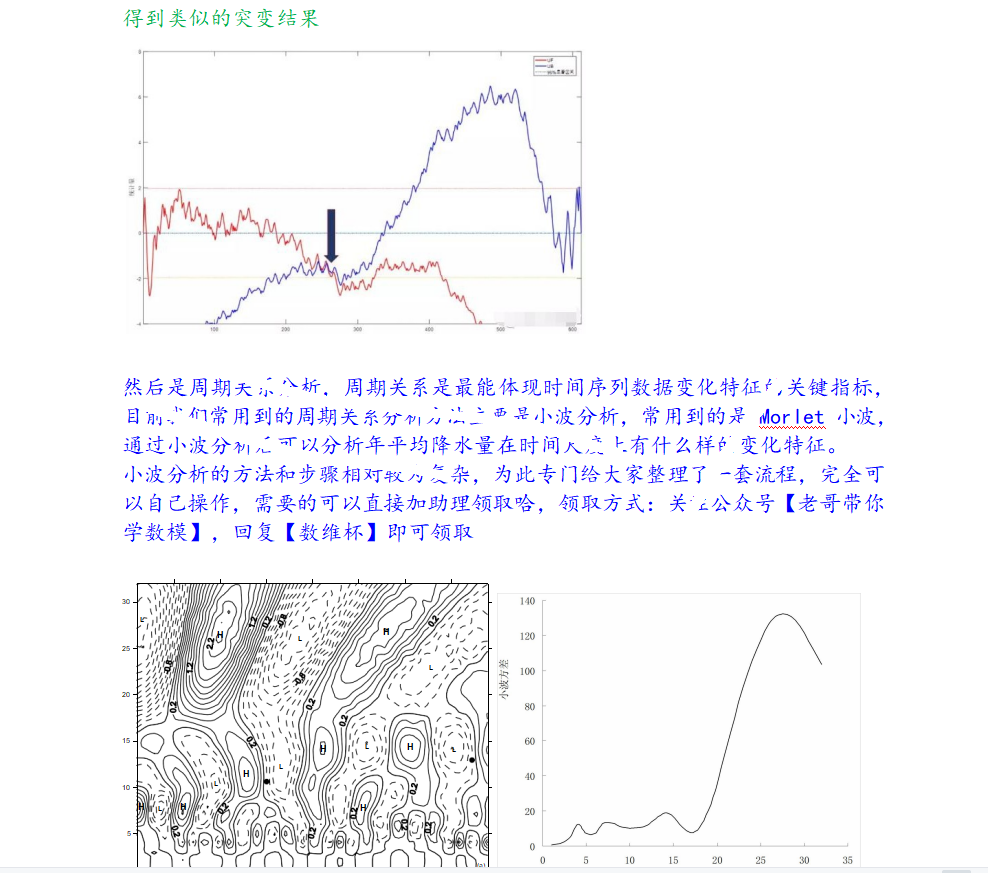
问题 1:对郑州地区降水特征的年变化特征进行相关分析,筛选出降水量较高的年份。同时,对郑州市 2021 年的洪水事件进行具体的定量分析。